Continuing to Optimize Dynamic Light Scattering Signal

Continuing to Optimize Dynamic Light Scattering Signal
In the last post I made detailing my time as an undergraduate researcher at the University of Mississippi, I described some of the difficulties I was facing in regards to the Dynamic Light Scattering (DLS) instrument.
Well, the drama and the trauma only increased this week, but needless to say, I've learned a lot more about DLS than I would have if everything had worked out perfectly the first time.
So what happened this week exactly?
Reducing the Signal-to-Noise Ratio
Pretty much the name of the game this week was to limit the noise that the DLS machine was picking up on. There were a lot of things that went into this and first and foremost I'll start with what I left off with last time: trying a new sample well plate with opaque walls instead of clear ones. My thought was that this would reduce the high intensities and the highly variable signals that I was getting from just de-ionized water and buffer alone.
So the plates came in earlier in the week and I got right to work on testing them out. But I didn't go full on DNA/mercury mode this time. I only tested de-ionized water and some buffers to see if that noise was as bad.
The result? Well, it helped. It definitely helped. It just didn't help as much as I wanted to. Okay, but progress is progress right? What would the next step be? Dr. Wadkins and I agreed that we should spend some time to figure out why in the world the DLS instrument was still picking up signals on deionized water and just pH buffers. There's not supposed to be nanoparticles in de-ionized water! So I filtered the de-ionized water and ran the test again but with mostly the same results. We concluded that there was something in the water that we just weren't able to get rid of. (The DLS instrument is a very high-maintenance machine...)
As a result, we moved to try Milli-Q water, which is pretty much de-ionized water on steroids. It's made in a machine (made by the Milli-Q company) that uses complex filters to take nearly everything out of water. In fact, I ditched the buffers I had and made new buffers that were dissolved in the Milli-Q water and filtered everything and tried to keep glassware rinsed/cleaned/covered as much as humanly possible so no dust got into the solutions.
After this, I compared some different buffers (more on that later on in the post) with the Milli-Q water. I was actually quite happy with the results this time. The Milli-Q water resulted in a much tighter range of signal amplitudes than the de-ionized water. This just means that, on average, less light was being scattered since the strength of the signal (amplitude) was lower.
Additionally, during this run, I tested the effectiveness of MOPS buffer and HEPES buffer, which are both a part of a class of pH buffers that are exceptionally good with stabilizing bio-molecules. I wanted to see if one had more chance of interacting with mercury than the others. For instance, the last thing I want in my DNA/mercury samples is a ton of signal coming from buffer/mercury aggregates acting like false positive.
So I titrated both MOPS and HEPES with mercury (in two trials, one with de-ionized water, and one with Milli-Q water) to see if there was anything different.
The Buffers
Below I have the structures of MOPS buffer and HEPES buffer respectively:
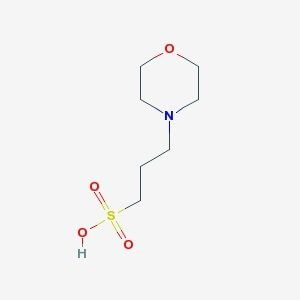
Structure of MOPS

Structure of HEPES
My hypothesis was that HEPES wasn't able to interact with the large mercury ion as easily as MOPS due to steric hindrance of another group (an ethyl hydroxy on the other end of the ring) since MOPS did not have a second similar electron-withdrawing group on the ring. It wasn't a hill I was going to die on, but I still wanted to test it.
And here are some basic results (primarily looking at signal amplitude as an indication of signal strength and therefore more light scattering):

Figure 1: Amplitudes for MOPS and HEPES buffers made with de-ionized water. The samples were exposed to [Hg] ranging from ~3 uM - ~33uM.

Figure 2: Amplitudes for MOPS and HEPES buffers made with Milli-Q water. The samples were exposed to [Hg] ranging from ~3 uM - ~33uM.
You can see from the scale of the y-axis on the graphs that the buffers in Milli-Q water had lower overall amplitude values than those in de-ionized water. Additionally, it can also be seen that MOPS experienced a higher variability in amplitude signals in both tests while HEPES maintained a comparably tighter amplitude range in both tests. Thus, I concluded that I should use HEPES as my buffer from now on in order to lower the background noise and therefore increase the signal-to-noise ratio to make spotting data from actual DNA/mercury aggregates easier.
What are my Next Steps?
If you have been following my Project Perseus line of posts, you know that I have been learning more about machine learning and AI. Well, what better way to learn that topic than to apply it to the data that I've been generating with the DLS?
So, yes my goal is to create an ML model to categorize signals as either buffer only (background junk), buffer/mercury complexes, DNA only, or the prized DNA/mercury nanoparticles.
The first step is to start a large enough dataset to train a model on. I've already started and I've collected 36 samples of "buffer only."

Figure 3: Amplitudes for 36 samples containing HEPES buffer.
Aside from 2-3 outliers the amplitude values look pretty consistent and consistently low, which is a good thing. Hopefully the model will train on this and be able to learn what the background noise is and then subtract that background noise from a potential DNA/mercury signal to get the true amount of signal created by the nanoparticles.
I think that's it for now. Next week I'll give another update on how things are doing. Thanks for reading and I'll see you next time!
Where thoughts orbit stars and dreams power suns...


Comments
Post a Comment